Completed
Inhalt/Content
Change of fully-processed mails
The diagram shows the difference between the count of fully processed mails of period 1 and the count of fully processed mails of period 2. Negative values indicate that less mails have been processed in the second time period.
Filters:
- Time Period 1 (closing / answering date of mails) limited to a length of max. 1 month
- Time Period 2 (closing / answering date of mails) limited to a length of max. 1 month
- Tenant
- Category
- Channel
- Transaction code
After the filters have been changed, the diagrams have to be reloaded through the button Load charts on the right hand side.
Now the system reads all matching mails within both given time periods and displays the difference as follows:
Count of mails of period 1 minus count of mails of period 2
The result may be displayed in three different types of grouping:
- Grouped by categories
- Grouped by channel
- Grouped by transaction code
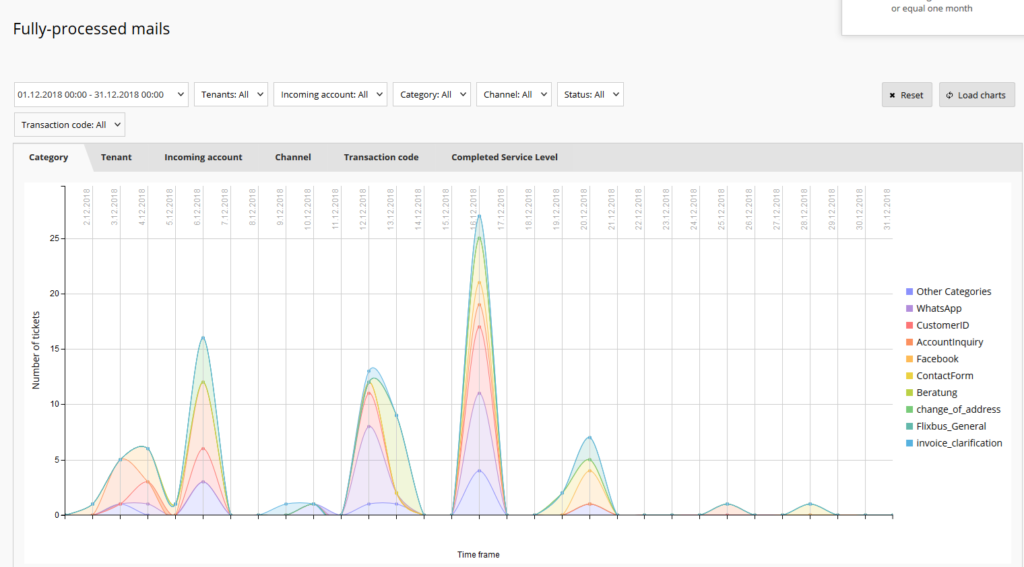
Fully-processed mails
This monitoring is designed to display fully processed mails in a given timeframe (max. 1 month long) and displays the values graphically in several charts.
Filters:
- Time Period 1 (closing / answering date of mails) limited to a length of max. 1 month
- Tenant
- Incoming account
- Category
- Channel
- Status
- Transaction code
After the filters have been changed, the diagrams have to be reloaded through the button Load charts on the right hand side.
A tool-tip on the diagram shows the specific values per grouping option.
The result may be displayed in several different types of grouping:
- Category
- Tenant
- Incoming account
- Channel
- Transaction code
- Completed Service Level
Shows a diagram with all closed mails grouped and colored by their reached servicelevel in the moment of closing. So one can recognize quickly how many mails exceeded their servicelevel.
